AnandTech Power Supply Test Methodology
by Christoph Katzer on July 12, 2007 12:00 AM EST- Posted in
- Cases/Cooling/PSUs
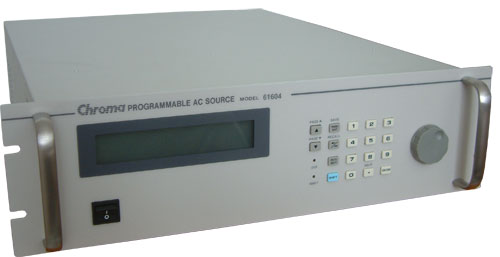
Chroma Programmable AC Source 61604

In most parts of the world it is usual to use a grid power of 230VAC with a frequency of 50Hz. In the US, Canada, and parts of South America however the standards are around 117VAC with a frequency of 60Hz (commonly rounded to 120VAC). To provide our readers the maximum range the units can handle, we are testing power supplies with multiple inputs in these different voltage ranges.
The difference in the DC output between 110VAC and 120VAC is marginal, but from 120VAC to 230VAC it's another story. Lower input voltage results in a higher energy usage by the power supply, and higher power usage lowers the efficiency of each power supply. Therefore we will see differences between tests at 115VAC and those at 230VAC. By covering these two different input voltages of 115VAC and 230VAC we will offer a good variety for all our readers and we will provide the only current public tests conducted at both input voltages.
The Chroma model 61604 is capable of providing 0 - 300VAC with a power up to 2000 volt-amperes (VA). The output frequency can be selected between 15Hz and 1000Hz. To simulate a perfect environment we use 50Hz for the test with 230VAC and 60Hz for 115VAC, which is what users generally find at the power grid in various countries.
However, our AC Source actually provides two functions. The first is that it acts as a normal AC Source, allowing us to test with different voltages. Second, it is also a power meter that gives us important data like power usage and power factor.

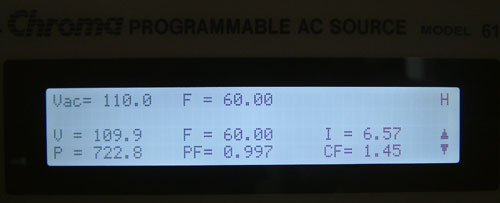
The display shows us several important numbers. The top row contains information regarding the power that we want the device to deliver. The two lower rows display the actual delivered voltage, power consumption from the power grid, frequency, power factor, current and the crest factor. For our tests the most important items are the voltage, frequency, power consumption and power factor. In our reviews we will include a graph which will show the energy loss from the power supply during testing as follows.

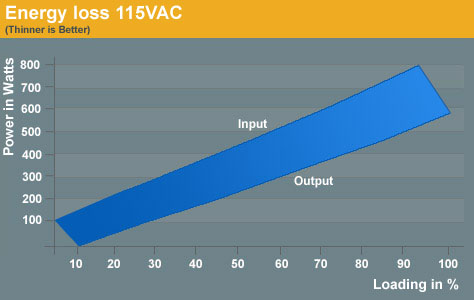
Sample Energy Loss
The upper line marked with Input is the actual power drawn from the power grid. The line below marked with Output is the DC power which is given to the PC. Usually at lower power draws from the system the power loss will be lower as well. This can be seen by the increasing distance between the two lines, which grows steadily with increasing power usage.
By loading a power supply at a specific level, we get both the power input and the power output. Dividing these two units gives the efficiency of each tested power supply. Efficiency has become a modern benchmark for power supplies and many companies build their complete marketing strategy on high efficiency. To make this efficiency readable we will use a graph which shows each step at a specific point of load. To get the best overall impression of a power supply we decided to test in steps of 10% of the actual load each power supply is able to deliver. The load of each rail is calculated in conformity with the Power Supply Design Guide V1.1 released by Intel in March of this year.

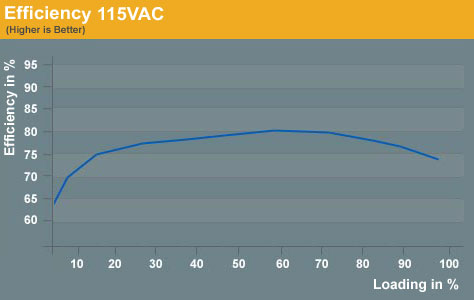
Sample Efficiency
The efficiency is normally displayed in a curve which starts at a low point around 60 to 70%. With increasing loads the curve will usually reach its zenith at 50% to 70% of the maximum load the power supply can handle. This means that at this point the power supply has its best efficiency and ideally it should spend most of its time running in this area. High loads push the power supply beyond this point to where the curve is normally heading down again.
The important thing to take away from this is that it's not easy to buy a perfect power supply for the home PC and a little bit of calculation needs to be done. Remember that the power supply should not run at lower or higher loads most of the time. The former happens when a user buys a power supply that provides more potential power than they need, while the latter occurs when users purchase power supplies that meet their minimum requirements. This is information that many marketing departments aren't interested in disseminating, however, and some companies are advertising power supplies rated at more than 1000W - something which few if any PCs will need at the moment.

In most parts of the world it is usual to use a grid power of 230VAC with a frequency of 50Hz. In the US, Canada, and parts of South America however the standards are around 117VAC with a frequency of 60Hz (commonly rounded to 120VAC). To provide our readers the maximum range the units can handle, we are testing power supplies with multiple inputs in these different voltage ranges.
The difference in the DC output between 110VAC and 120VAC is marginal, but from 120VAC to 230VAC it's another story. Lower input voltage results in a higher energy usage by the power supply, and higher power usage lowers the efficiency of each power supply. Therefore we will see differences between tests at 115VAC and those at 230VAC. By covering these two different input voltages of 115VAC and 230VAC we will offer a good variety for all our readers and we will provide the only current public tests conducted at both input voltages.
The Chroma model 61604 is capable of providing 0 - 300VAC with a power up to 2000 volt-amperes (VA). The output frequency can be selected between 15Hz and 1000Hz. To simulate a perfect environment we use 50Hz for the test with 230VAC and 60Hz for 115VAC, which is what users generally find at the power grid in various countries.
However, our AC Source actually provides two functions. The first is that it acts as a normal AC Source, allowing us to test with different voltages. Second, it is also a power meter that gives us important data like power usage and power factor.

The display shows us several important numbers. The top row contains information regarding the power that we want the device to deliver. The two lower rows display the actual delivered voltage, power consumption from the power grid, frequency, power factor, current and the crest factor. For our tests the most important items are the voltage, frequency, power consumption and power factor. In our reviews we will include a graph which will show the energy loss from the power supply during testing as follows.

Sample Energy Loss
The upper line marked with Input is the actual power drawn from the power grid. The line below marked with Output is the DC power which is given to the PC. Usually at lower power draws from the system the power loss will be lower as well. This can be seen by the increasing distance between the two lines, which grows steadily with increasing power usage.
By loading a power supply at a specific level, we get both the power input and the power output. Dividing these two units gives the efficiency of each tested power supply. Efficiency has become a modern benchmark for power supplies and many companies build their complete marketing strategy on high efficiency. To make this efficiency readable we will use a graph which shows each step at a specific point of load. To get the best overall impression of a power supply we decided to test in steps of 10% of the actual load each power supply is able to deliver. The load of each rail is calculated in conformity with the Power Supply Design Guide V1.1 released by Intel in March of this year.

Sample Efficiency
The efficiency is normally displayed in a curve which starts at a low point around 60 to 70%. With increasing loads the curve will usually reach its zenith at 50% to 70% of the maximum load the power supply can handle. This means that at this point the power supply has its best efficiency and ideally it should spend most of its time running in this area. High loads push the power supply beyond this point to where the curve is normally heading down again.
The important thing to take away from this is that it's not easy to buy a perfect power supply for the home PC and a little bit of calculation needs to be done. Remember that the power supply should not run at lower or higher loads most of the time. The former happens when a user buys a power supply that provides more potential power than they need, while the latter occurs when users purchase power supplies that meet their minimum requirements. This is information that many marketing departments aren't interested in disseminating, however, and some companies are advertising power supplies rated at more than 1000W - something which few if any PCs will need at the moment.


49 Comments
View All Comments
Adul - Thursday, July 12, 2007 - link
I'd love to see a power supply catch fire :). Maybe one of the cheaper ones will break enough for this.CrystalBay - Thursday, July 12, 2007 - link
I would also like to see a short video of substandard PSU's lighting up...I'm sure many enthusiasts have had Dram's start flaming or smoke. But I have never had a PSU actually catch flame out....
Martimus - Thursday, July 12, 2007 - link
I had a Antec NeoPower PSU spew black smoke. It was not fun. Also fried my motherboard. It was less than 6 months old too, and I wasn't using it at anywhere near it's supposed capacity.BladeVenom - Thursday, July 12, 2007 - link
Then test power supplies that are in the range that most people actually need. Also test some budget ones. Let's see which ones are good for the money, and which ones are fire hazards.
xsilver - Thursday, July 12, 2007 - link
what is meant is that the idea of having a psu is NOT to load it to 100% capacity.and the problem being that it is very difficult to get a stable and repeatable psu testing setup.
I highly recommend that industrial manufacturers be pointed out just like in xbit labs reviews. That way we will know that antec has 3 or more suppliers providing psu's and be able to tell the seasonics from the other crud ;)
Wesleyrpg - Thursday, July 12, 2007 - link
hmm i wonder if thats why some people rave about Antec and some people like me curse them! I'd have to say Antec have the worst failure rate by far, probably at about 75% in the first year, where i can buy a $22 550W Generic (Honli) and only have about a 25% failure rate, maybe thats related to the power supplys released into australia by antec.imaheadcase - Thursday, July 12, 2007 - link
I kid! :Pgersson - Thursday, July 12, 2007 - link
just a red 'X'gersson - Thursday, July 12, 2007 - link
nevermind -- working already :-)